FLEXmarket Results and Data Summary, June 2023
FLEXmarkets Progress To Date as of 6/6/23 - Data Sources & Notes
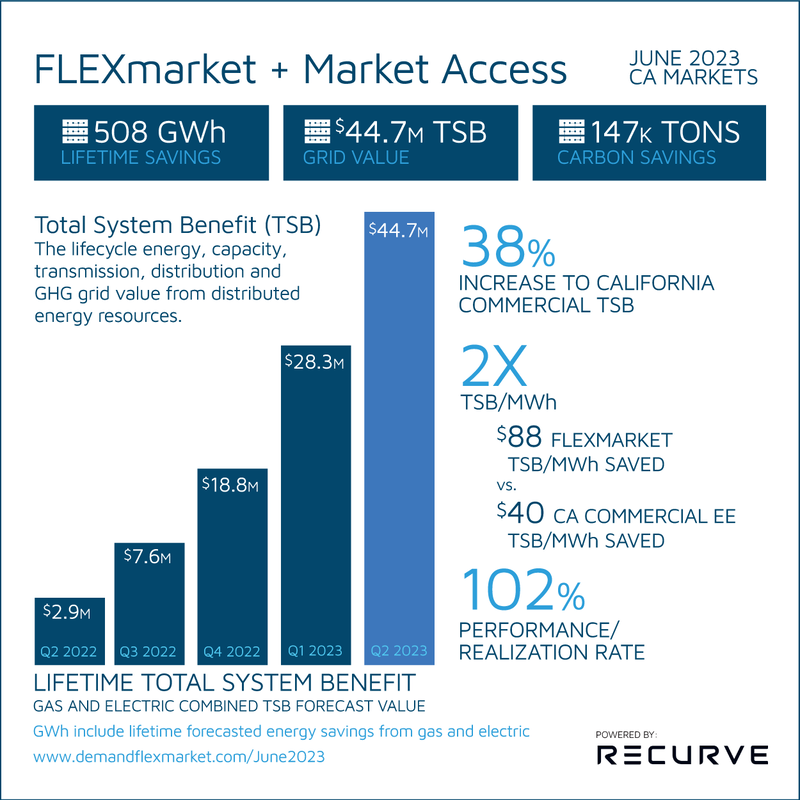
This document outlines the sources used to generate FLEXmarket progress-to-date metrics as of June 2023. Figures represent the status of Recurve markets as of June 6th, 2023 based on forecasted total system benefits for the lifetime of each enrolled project. All MWh in this graphic represent lifetime forecasted impacts from both gas and electric savings, for consistent comparison with TSB value.
Comparisons to the California commercial energy efficiency portfolio are relative to the final quarterly claims for all program administrators in 2022 (on CEDARS as of 7/31/2023) but do not include impacts of codes and standards. This analysis provides directional insights on how the FLEXmarket has compared to a typical year of energy efficiency programs. We have done our best to present direct and accurate comparisons, but some caveats are necessary for presenting and sharing this information.
How Recurve Calculates Savings
The advanced Normalized Metered Energy Consumption (NMEC) methods Recurve uses for these calculations were developed in a public process and are implemented using open-source code. The CalTRACK methods, part of the OpenEEmeter project, are used to compare baseline period (pre-program) energy usage to the energy consumption measured post-intervention to calculate project savings. These savings are then adjusted for exogenous impacts using the GRIDmeter with either granular profiles or non-participant data, depending on the design of the FLEXmarket, to arrive at the final savings values. Finally, if a project is excluded because of an NMEC exclusion criteria, then a savings value will be assigned to the project based on similar projects in the program.
The % difference of differences is calculated between savings in the treated population and the matched comparison groups, resulting in savings and load shape impacts, net of population-level exogenous effects.
The CalTRACK methods are central to both the comparison group sampling step and the meter-based savings calculations. CalTRACK methods yield advanced daily and hourly baseline calculations via modeling each building based on occupancy and weather conditions throughout the year.
The CalTRACK methods are consistent with all International Performance Measurement and Verification Protocols (IPMVP Option C). CalTRACK is a detailed specification that includes rigorous steps for data cleaning and organization, weather station selection and weather normalization, and selection of specific model parameters to best fit the raw consumption data.
The GRIDmeter comparison group sampling methods were developed in an open stakeholder process in partnership with the US Department of Energy. The GRIDmeter methods apply stratified sampling or site-based matching to identify non-participant comparison groups in order to adjust for population-levelexogenous factors at the granularity of the consumption data. The GRIDmeter methods have proven accurate through empirical testing for both residential and commercial applications.
Additional information:
What is Included in this Analysis
This document outlines the sources used to generate FLEXmarket progress-to-date metrics as of June 2023. Figures represent the status of Recurve markets as of June 6th, 2023 based on forecasted total system benefits for the lifetime of each enrolled project. All MWh in this graphic represent lifetime forecasted impacts from both gas and electric savings, for consistent comparison with TSB value.
Comparisons to the California commercial energy efficiency portfolio are relative to the final quarterly claims for all program administrators in 2022 (on CEDARS as of 7/31/2023) but do not include impacts of codes and standards. This analysis provides directional insights on how the FLEXmarket has compared to a typical year of energy efficiency programs. We have done our best to present direct and accurate comparisons, but some caveats are necessary for presenting and sharing this information.
How Recurve Calculates Savings
The advanced Normalized Metered Energy Consumption (NMEC) methods Recurve uses for these calculations were developed in a public process and are implemented using open-source code. The CalTRACK methods, part of the OpenEEmeter project, are used to compare baseline period (pre-program) energy usage to the energy consumption measured post-intervention to calculate project savings. These savings are then adjusted for exogenous impacts using the GRIDmeter with either granular profiles or non-participant data, depending on the design of the FLEXmarket, to arrive at the final savings values. Finally, if a project is excluded because of an NMEC exclusion criteria, then a savings value will be assigned to the project based on similar projects in the program.
The % difference of differences is calculated between savings in the treated population and the matched comparison groups, resulting in savings and load shape impacts, net of population-level exogenous effects.
The CalTRACK methods are central to both the comparison group sampling step and the meter-based savings calculations. CalTRACK methods yield advanced daily and hourly baseline calculations via modeling each building based on occupancy and weather conditions throughout the year.
The CalTRACK methods are consistent with all International Performance Measurement and Verification Protocols (IPMVP Option C). CalTRACK is a detailed specification that includes rigorous steps for data cleaning and organization, weather station selection and weather normalization, and selection of specific model parameters to best fit the raw consumption data.
The GRIDmeter comparison group sampling methods were developed in an open stakeholder process in partnership with the US Department of Energy. The GRIDmeter methods apply stratified sampling or site-based matching to identify non-participant comparison groups in order to adjust for population-levelexogenous factors at the granularity of the consumption data. The GRIDmeter methods have proven accurate through empirical testing for both residential and commercial applications.
Additional information:
- The CalTRACK methods are fully specified here.
- A summary of the CalTRACK Daily Methods is available here.
- A summary of the CalTRACK Hourly Methods is available here.
- The CalTRACK Technical Appendix contains a great deal of additional information including results of empirical testing that guided methodological decisions.
- The OpenEEmeter is the Python Codebase that Recurve uses to implement the CalTRACK methods. This codebase is open source and available here.
- The full description of the GRIDmeter methods is available in the report, Comparison Groups for the COVID Era and Beyond.
- The GRIDmeter methods are implemented by the GRIDmeter codebase, which is also open-source and publicly available here.
What is Included in this Analysis
Grid Impact Calculations include Forecasted Lifetime Total System Benefit (Lifetime TSB), Forecasted Lifetime kWh Savings, and Forecasted Lifetime Greenhouse Gas (GHG) Savings.
Lifetime TSB is based on first year resource curve (load shape impact) over the Effective Useful Life (EUL) of the anchor measure(s), with a 7.6% utility discount rate. This does not include additional non-system benefits that are of value to the particular CCA or REN running the market, but is anchored in the Avoided Cost Calculator value approved by the CPUC annually and minor modifications were allowed for peak impacts for the Market Access program.
Lifetime kWh Savings:
Carbon (GHG) Savings:
Realization Rates: Forecasted and measured TSB and kWh savings of the MCE and PG&E Market Access programs were analyzed to produce the reported realization rates
Comparison to CA Commercial Portfolio: CA commercial portfolio comparisons are made using CA commercial programs (all program administrators including REN and CCAs but excluding Codes & Standards) from the 2022 CPUC CEDARS final quarterly report for the full year (downloaded 7/31/2023) to Recurve FLEXmarkets to-date since inception. The 2022 CEDARS data serves as a benchmark for the additive impacts FLEXmarkets are forecasted to deliver over a typical year of energy efficiency activity.
Lifetime TSB is based on first year resource curve (load shape impact) over the Effective Useful Life (EUL) of the anchor measure(s), with a 7.6% utility discount rate. This does not include additional non-system benefits that are of value to the particular CCA or REN running the market, but is anchored in the Avoided Cost Calculator value approved by the CPUC annually and minor modifications were allowed for peak impacts for the Market Access program.
Lifetime kWh Savings:
- Net electric first-year savings and net gas first-year savings converted to MMBTUs, added together, then converted to kWh to compare to CEDARS.
- Net-to-Gross ratios applied vary by sector/customer category:
- Commercial projects: .95
- Residential projects: .85
- Hard-to-Reach Residential projects: 1.0
- Net-to-Gross ratios applied vary by sector/customer category:
Carbon (GHG) Savings:
- Electricity lifecycle GHG savings in tons and gas lifecycle GHG savings in tons are outputted from FLEXvalue (source value is the Avoided Cost Calculator approved by CPUC), post net-to-gross calculations, and added together for total lifecycle GHG savings.
Realization Rates: Forecasted and measured TSB and kWh savings of the MCE and PG&E Market Access programs were analyzed to produce the reported realization rates
- Projects with one year of measured Tracking data, calculated using total measured kWh savings divided by forecasted kWh savings and measured TSB divided by forecasted TSB.
- kWh realization rates are calculated by comparing measured year 1 kWh savings and forecasted year 1 kWh savings across all measured hours for projects without a year of measured savings.
- DEER load shape is assigned based on the customer/measure combination
- Savings is applied across the DEER load shape to produce an 8760 hourly savings "resource curve"
- This resource curve is extended to the number of years set by the EUL to determine forecasted lifetime kWh savings
- The resource curve is run through a smoothed avoided cost calculator to determine forecasted lifetime TSB
- TSB realization rates are calculated by comparing measured year 1 TSB and forecasted year 1 TSB across all measured hours
Comparison to CA Commercial Portfolio: CA commercial portfolio comparisons are made using CA commercial programs (all program administrators including REN and CCAs but excluding Codes & Standards) from the 2022 CPUC CEDARS final quarterly report for the full year (downloaded 7/31/2023) to Recurve FLEXmarkets to-date since inception. The 2022 CEDARS data serves as a benchmark for the additive impacts FLEXmarkets are forecasted to deliver over a typical year of energy efficiency activity.
*lifecycle kWh include therms and kWh converted to MMBTU then back to kWh for a fair comparison with total value of TSB.


