How Does the IRA HOMES Measured Performance Path Work?
|
The IRA HOMES residential energy savings program allocates $4.3 billion for states to administer incentives for single and multifamily upgrades. State Energy Offices, by formula, will receive a share of the $4.3B in funding.
The Measured Performance pathway provides an opportunity for rapid, low-risk implementation. Using meter data (monthly or hourly) to measure the impact of energy efficiency interventions with open-source Advanced M&V, the Measured Performance pathway pays aggregators for what they deliver at the meter, ensuring taxpayer funds are spent on actual results. State Energy Offices may implement the Measured Performance pathway as a market (such as the FLEXmarket) or stack incentives with existing utility programs to increase program adoption and savings for customers and the grid. This approach can be as easy as coordinating with existing programs (such as utility customer programs) and simply reporting auditable results. Recurve is pleased to provide resources to regulators and state energy officials to support the design of the IRA HOMES Measured Performance pathway. 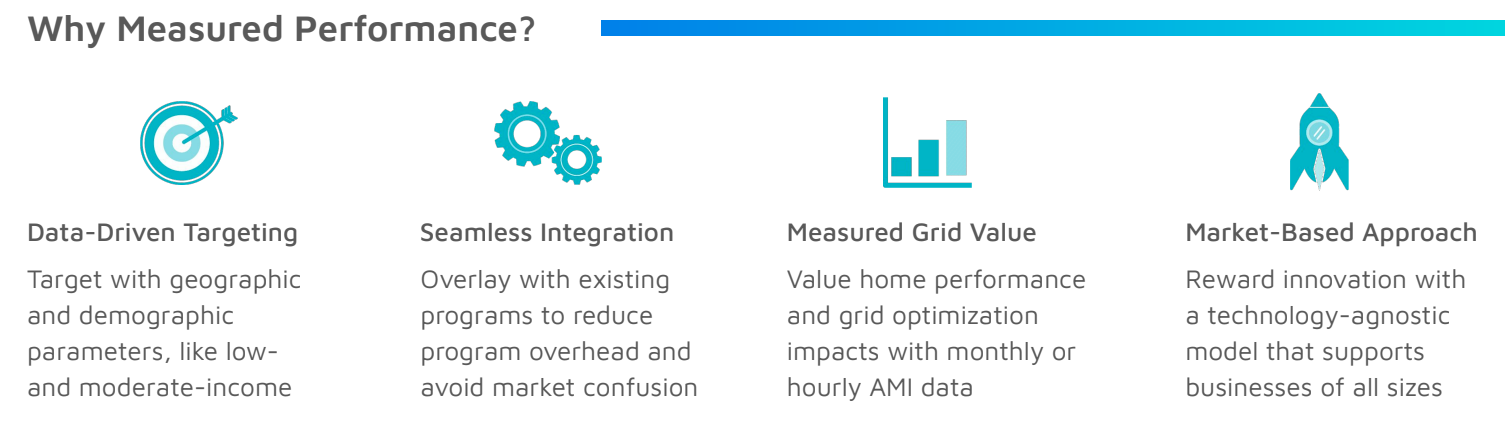
|
Utilities know how to implement Advanced M&V
Flex Coalition: Case Studies and Best Practices
|
Determining Payable Savings for HOMES Measured Path
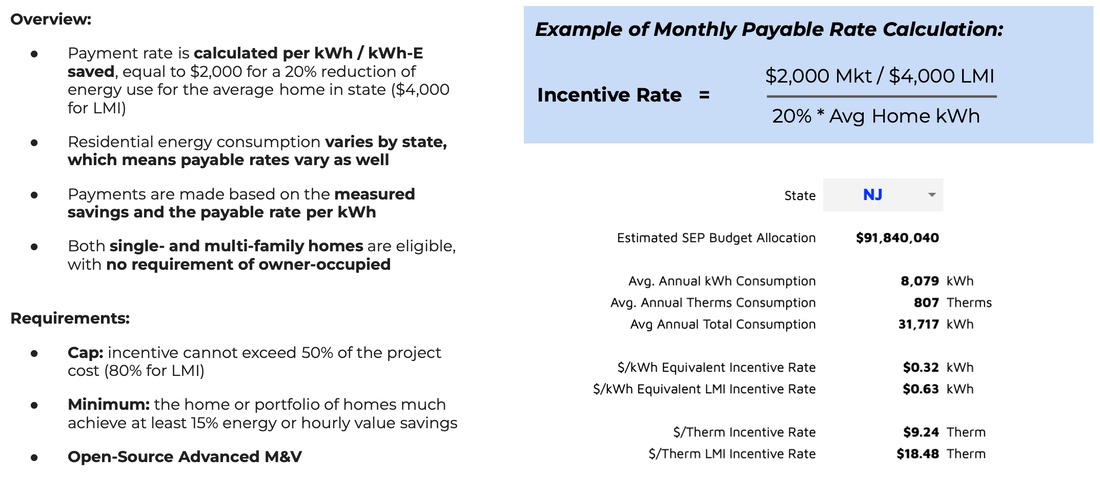
In the Measured Performance pathway, incentives are calculated based on a price per unit of savings, either
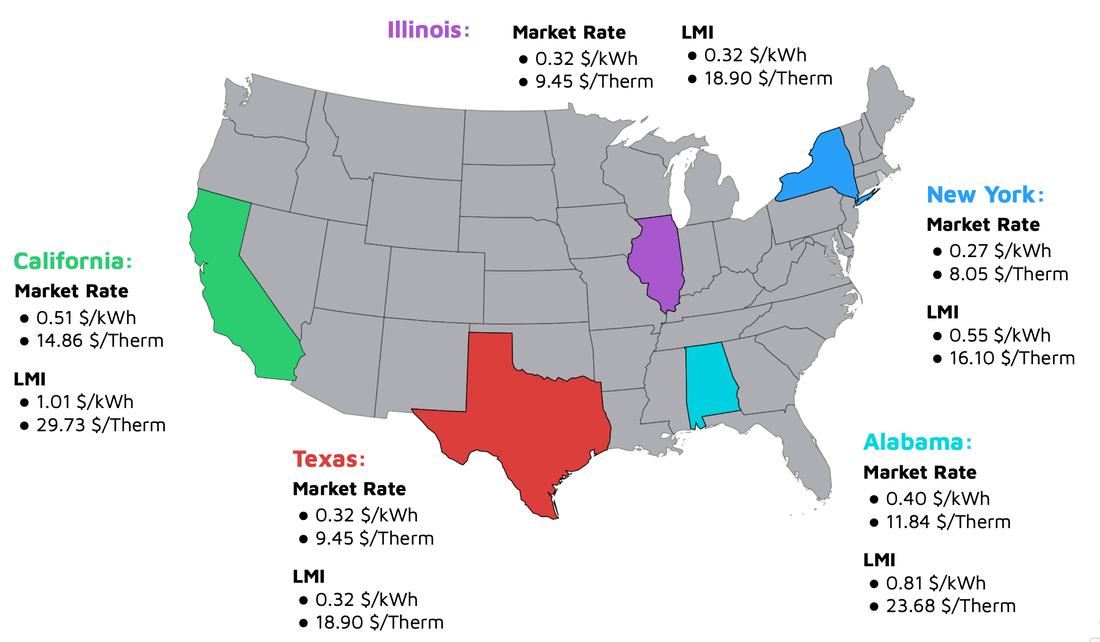
Recurve has created a HOMES Performance Incentive Calculator that provides each state with an estimate of kWh and Therm reduction incentive values. The calculator also includes a straightforward means to arrive at incentive values based on time, location, and GHGs for states with smart meter interval (AMI) data.
- kWh or
- the time, location, and greenhouse gas (GHG) value of hourly savings.
Recurve has created a HOMES Performance Incentive Calculator that provides each state with an estimate of kWh and Therm reduction incentive values. The calculator also includes a straightforward means to arrive at incentive values based on time, location, and GHGs for states with smart meter interval (AMI) data.
|
Monthly Payable Rate Examples
|
HOMES Performance Incentive Calculator
|
Recurve is pleased to provide access to the HOMES Performance Incentive Calculator.
To gain access to the calculator, please fill out the form on the right. We will set up a calculator with your state's data and provide you with a login. We are happy to provide technical assistance upon request. 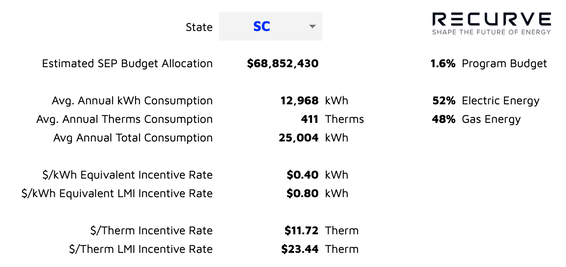
Example of Monthly and Hourly Value Calculation
|
|
Measured Path FAQ
|
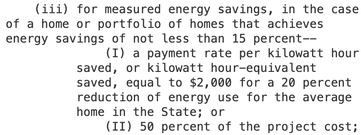
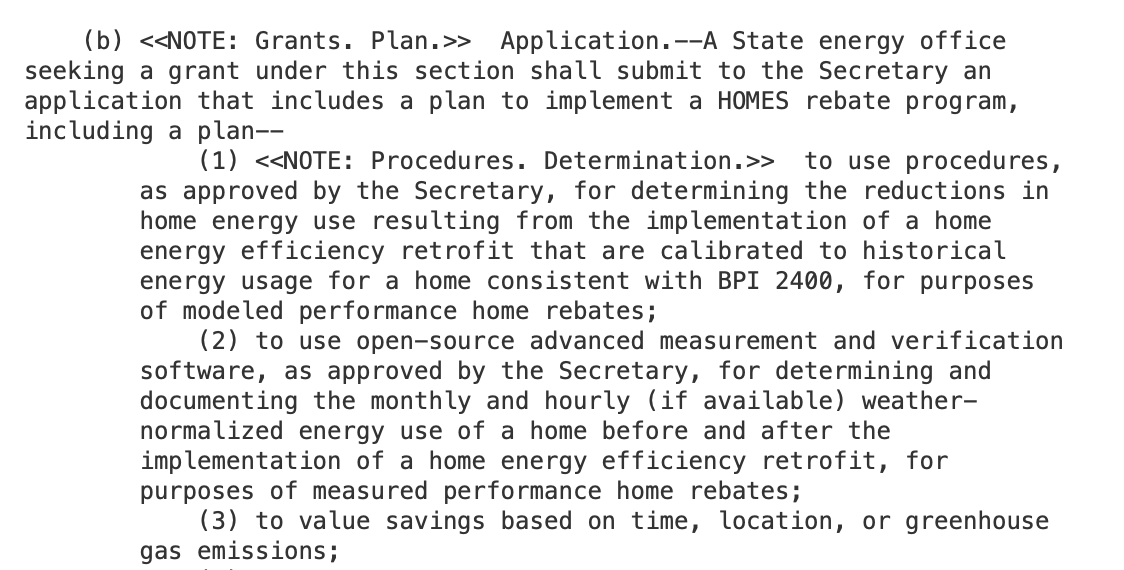
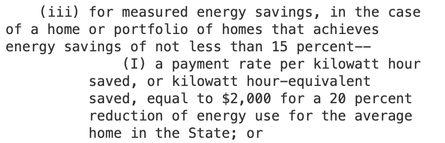
The IRA requires that in the case of measured performance, homes or portfolios of homes achieve at least 15% energy savings. It then defines energy savings as a kWh or kWh equivalent.
The legislation is clear that SEOs shall submit a plan that includes calibrated modeling, open-source advanced M&V and that they shall value savings based on time, location, or greenhouse gas emissions. The legislation requires open-source advanced measurement and verification software to determine monthly and hourly savings, if available. This means that when AMI / interval data is available, one must measure a home's monthly and hourly weather-normalized energy use. |
|
Converting from monthly to hourly values can align savings with TOU rates and actual customer bill savings; it can also send a signal that reflects the GHG and grid value stemming from energy projects (aka, the Virtual Power Plant).
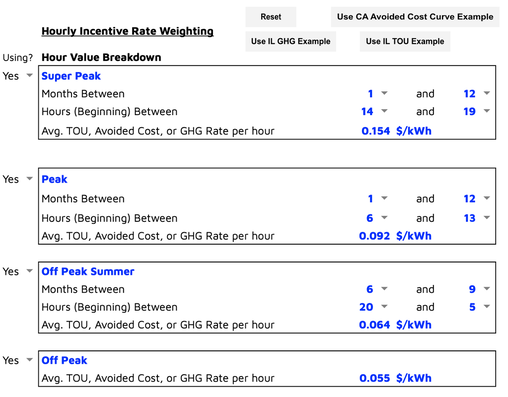
The Calculator can take any of these values for up to four (4) time periods (time of day and month of the year). In practice, you can have as few as two rates or even a different value for every hour of the year. Simple is often just fine and a vast improvement over treating all savings in every hour the same.
The Calculator can take any of these values for up to four (4) time periods (time of day and month of the year). In practice, you can have as few as two rates or even a different value for every hour of the year. Simple is often just fine and a vast improvement over treating all savings in every hour the same.
|
Hourly values can be as complex (like the California Avoided Cost Calculator, which has a stack of values for all 8760 hours of the year) or as simple as using a TOU rate plan, Hourly GHGs from an ISO or Utility, or even just paying 3x as much during system peaks.
The calculator input (shown below) can accept tons of carbon, the retail price per kWh, or the system value per MWh to determine hourly incentive rates. The calculator computes the ratio between hours (is one hour 2x the value of another?) and then applies these ratios. For an average house that saves 20%, the total incentive will still be worth $2,000, but savings in different periods are priced differently, some above and some below the monthly average value. The buttons at the top of the calculator are macros to give you a few things to play with, but feel free to make this calculator your own! |
|
|
Achieving a 15% reduction in kWh, let alone the 20% specified in the Modeled pathway, is more difficult than it sounds—most home performance programs average between 9% and 14% total energy savings.
Average kWh savings is not necessarily the best indicator of bill savings, as increasing numbers of customers are on Time of Use rates. With Time of Use rates, bill savings are a function of when savings happen. It is also true that grid and GHG values vary significantly across different hours (time) and places (location) on the grid. |
|
The IRA Measured path enables State Energy Offices to send a time, location, or GHG signal (see above for how).

|
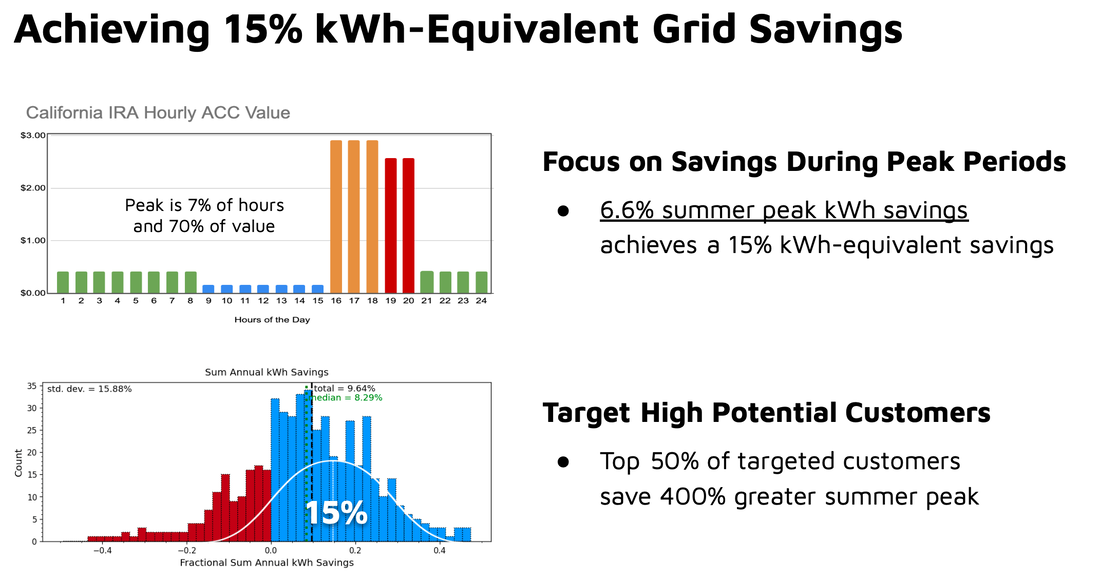
Calculating savings based on time, location, or greenhouse gas emissions increases the value of efficiency to customers and the grid and makes saving 15% or greater much more achievable.
Projects that focus on reducing energy during hours valued higher than others, such as summer peak, can achieve time, location, and GHG savings exceeding this threshold. In addition, aggregators can target the customers with the highest usage in those peak hours to further maximize the impact. |
|
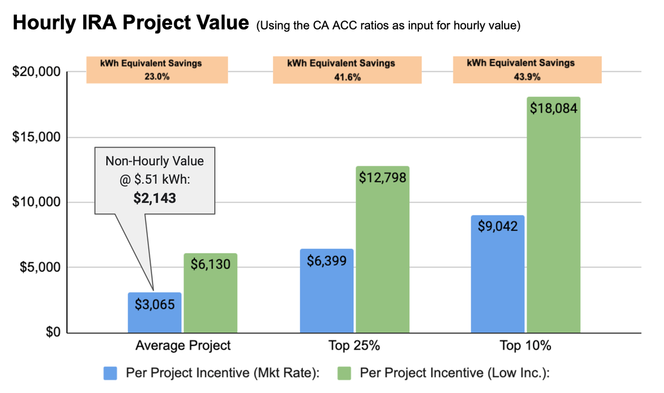
The chart below shows the value of an actual portfolio of just over 1,000 electrification projects. The projects target customers with air conditioning usage with shell reductions and high-efficiency heat pumps. This results in peak savings of over 20%, which coincides with the most valuable period on this state's grid (and also the most valuable hours from an IRA perspective).
This actual portfolio delivers 23% kWh Equivalent Savings (incorporating the value of time, location, and GHG emissions reductions). Targeting high-potential customers can achieve as much as 43.9% reductions.
This actual portfolio delivers 23% kWh Equivalent Savings (incorporating the value of time, location, and GHG emissions reductions). Targeting high-potential customers can achieve as much as 43.9% reductions.

Click for More Information about VPPs
Recurve DOE IRA HOMES RFI Response
The US Department of Energy recently issued a Request for Information (RFI) to inform the development of the Home Energy Rebate Programs outlined in the Inflation Reduction Act. The full RFI includes sixty questions regarding equitable program design, tools, metrics, and sustainability.
You can review Recurve's response to many of the questions posed here. We would be happy to follow up on any questions you have about our responses or discuss strategies to implement the HOMES measured pathway. Reach out here. HOMES has the potential to revolutionize the market, and we're excited to share this progress with you. |
|
The information on this page is made available by Recurve based on the best information available at the time of its development. However, Recurve does not guarantee the accuracy, completeness, or reliability of the web page’s outputs, and expressly disclaims any liability for errors or omissions in the information provided, as well as the results generated by the calculator. Additionally, these resources are designed to assist users in understanding the HOMEs rebate programs and help estimate potential energy savings and related metrics, but should not be relied upon as a substitute for professional guidance. Furthermore, Recurve cannot predict the final guidelines or requirements of the Department of Energy (DOE), and the results generated by the calculator provided may not align with DOE’s final guidelines. Users should refer to the most current information available from DOE or other reliable sources before making any decisions based on the information provided and the results of the calculator. By using these resources, you agree to indemnify and hold harmless Recurve from any claims, damages, or losses arising from or related to your use of the information provided or calculator.